Introduction
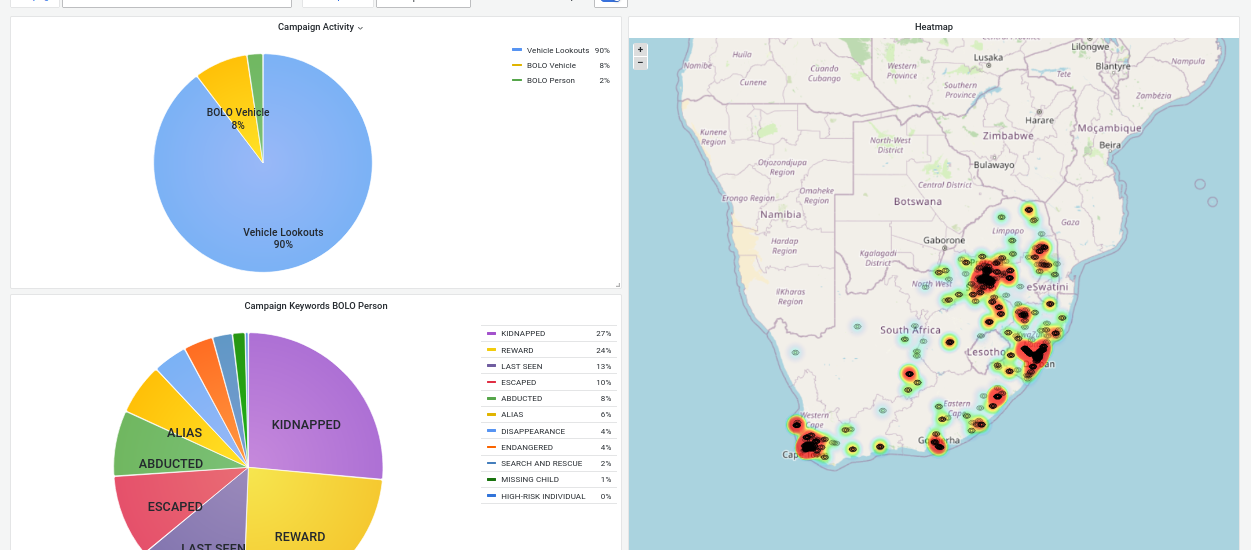
NPS-KPI focuses on data visualization, providing tools to create dashboards and visual reports. It helps users make sense of complex data through clear and concise visual representations.
Key Features
- Dashboard Creation: Build custom dashboards to display key metrics.
- Data Reporting: Generate reports for stakeholders with visual data insights.
- Interactive Charts: Use charts and graphs to explore data trends and patterns.
User Interface
- Dashboard Search: Find and access pre-built dashboards.
- Dashboard Viewer: View and interact with dashboards to extract insights.
- Report Generation: Export data and visuals for presentations and reports.


